


Blog
Storytelling Visualized: Assigning Functions to a Narrative
You can feel a good story in your core- the sadness, the suspense, the bitterness, and the beauty. We are good at registering and reacting to all of the characters, events, and plot twists a story throws at us, but have you ever tried to look at one through the eyes of a mathematician? What would a story look like without words, without pictures, its content plotted on a graph?
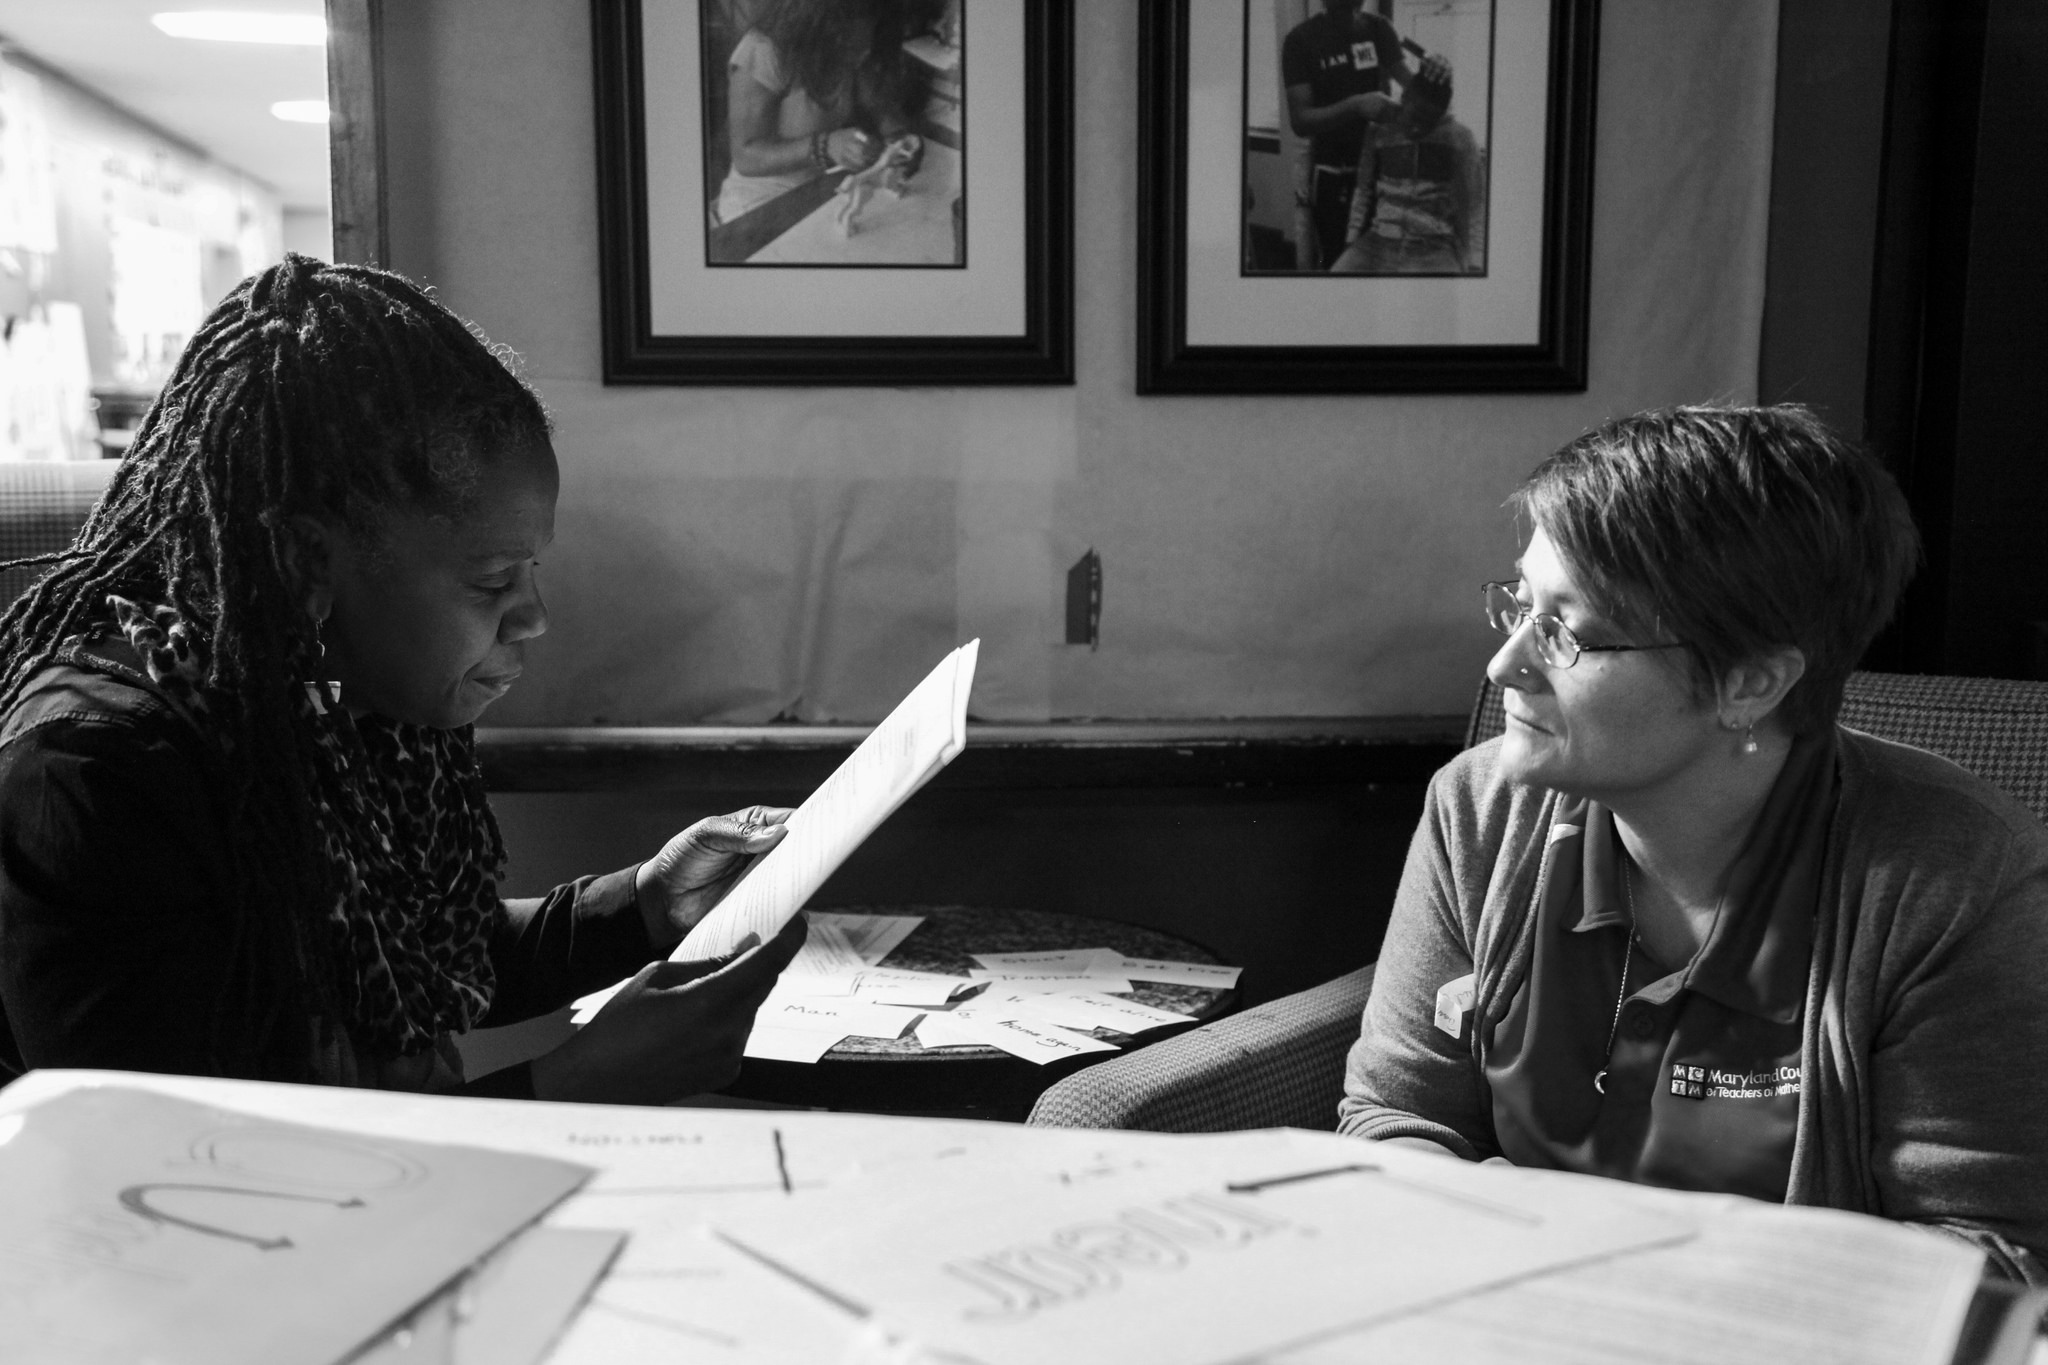
YA teaching artist and storyteller TAHIRA and Amy Goodman, Math Department Chair at North County High School (NCHS), collaborated in the development of a unique residency through the Teaching Artist Institute (TAI) to show just that. NCHS is one of 12 in Northern Anne Arundel County benefiting from professional development like TAI, in-school arts integration, and out-of-school arts programming as part of the Arts Empowered Minds Initiative (AEMI), a partnership aimed at ensuring equitable access to the arts for Northern Anne Arundel County Public Schools.
TAHIRA: What happened that surprised you?
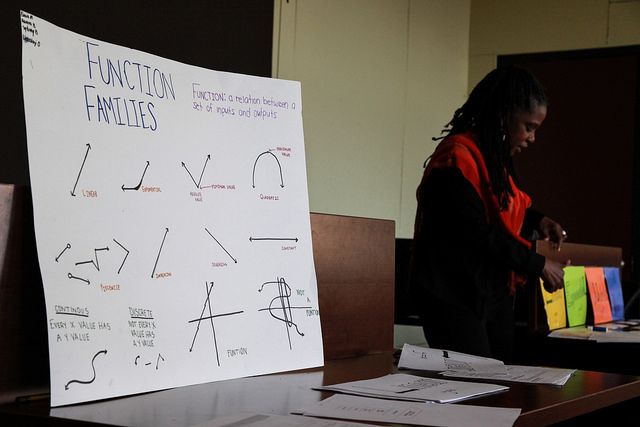
Student: As you were telling the story, the story was compared to math- because events were escalating like in a graph. And then when events took a downfall in the story, the graph started decreasing.
TAHIRA: Then the class had to describe what function the story plotted out, right?
Student: Exponential.
TAHIRA: Yeah, it was exponential. And you had a reaction to all that. What did you say? Do you remember what you said?
Student: I was surprised at how the story could be compared to math.
Each student was asked to illustrate why they chose a particular function over another to describe the characteristics of the story. Could there be more than one answer? Two students each shared their understanding of how a story unfolded by taking turns plotting it out on the same graph, compared and contrasted their unique perspectives, then decided if both functions made sense or if one more accurately described the story than the other.
TAHIRA: Did it make you look at storytelling differently? Or math differently- or help you understand the math?
Student: Yeah, it helped me understand how the graph can be compared to anything such as… in the story, when everything goes wrong, the graph decreases and it shows how it takes a negative effect.
TAHIRA: Exactly. And then?
Student: And then everything comes back together and that creates a positive effect.
TAHIRA: And we talked about the parts of a story: There’s a beginning…
Student: A middle and an end… when there’s a conflict, the two forces, the positive and the negative collide and whoever wins- that’s how the story plays out.
TAHIRA: Exactly, how it plays out- that’s right, it’s called a resolution.
The Arts Empowered Minds Initiative is the combined effort of many groups and individuals seeking to build a movement for increased equity through the arts in their community. With funding from the NEA in 2016, we built partnerships with Anne Arundel County Public Schools (AACPS), Chesapeake Arts Center (CAC), Arts Education in Maryland Schools Alliance (AEMS), Arts Council of Anne Arundel County, and University of Maryland – Baltimore County (UMBC).